The Melodious World of Data Sonification

Anything with data points can be turned into music.

Math is not my strong suit. Nor is computer programming. I’m not saying that I’m incapable of learning. I can learn anything I put my mind to (and so can you). But I lack the desire. I have to find something interesting or necessary to my life in order to want to master it.

While mathematics never interested me, I do have a healthy respect for and awe of them. I love symmetry with a bit of surprise. I love fractals. I love how pi and the golden ratio pop up everywhere. I love that there are paradoxes that we may never understand. Most of all, I love that music is math.

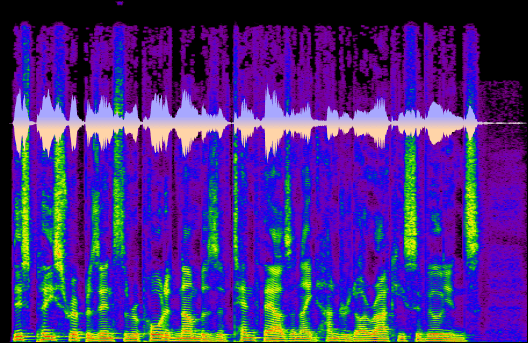
Having said that, I am quite fascinated by data sonification. You can take any data set in the world and convert each data point into a musical note to be played on instruments of your choosing, and get the most haunting and often comforting melodies. I stumbled upon some amazing examples of this just the other day.

I strongly urge you to hop on over the NASA website and hear how a scientist and his brother developed a program that took satellite imagery of our oceans and broke the colors out into data points, and then turned that into some really beautiful music. And each area of the sea sounds distinct. It’s really fascinating. The end result is called “Sounds of the Sea” and I, for one, will be playing it over and over again. It’s as if nature is its own conductor. Nasa has also “sonified” areas of the cosmos, and you can listen to them here.

But NASA isn’t the only one jumping on the data sonification bandwagon. Check out this data sonification archive. There, you can listen to the music of monetary transactions in India, to Twitter hashtags melodified, to the sonification of medical data. There is one creation called Digital Violence based on crime statistics. Not everything in the archive is publicly accessible, but many are. You just have to be patient with each download, if your computer is as slow as mine is. But it’s worth the wait.

Even COVID-19 has been sonified. (The sound of that one kind of makes me anxious. It’s almost as if the music knew what it was talking about.) You can find data sonification recordings all over the internet, from YouTube to Twitter to… well, plug it into your search engine. You’ll see.

Fair warning, though. You might get hooked.

Like the way my neurodivergent mind works? Then you’ll enjoy my book! http://amzn.to/2mlPVh5

3 responses to “The Melodious World of Data Sonification”

  1. The geeky scientist and creative artist in me rejoices to have another way to merge art and science and express the harmonic results. This explanation of how this process is used, beneficially, popped up while viewing the covid one. https://www.youtube.com/watch?v=5Bu440Y1rvI
    Outside of just enjoying the musical aspects of this technology, I’m trying to understand how it actually converts data points and pixels into sounds and what amount of manipulation of the original result is done to create songs. There’s so many ways to ‘color’ a sound that can enhance or distort it. Once manipulated, will you get the original picture when reversing the process or an abstracted representation of it? All of this leads me to artistic synethesiacs who see images when hearing music or sounds, a trait more prevalent amongst autistics I wish I could develop. https://www.youtube.com/watch?v=Ru3ws53gxII As it is, I experience auditory-tactile synesthesia. Certain music, frequencies really mess with me physically. Sometimes it’s bliss sometimes it’s skin crawling, twitching torture. Once I swear it felt like I weightlessly floated out of my skin. Fortunately, if not caught off guard, I can minimize it’s control over my body in public. I love how all of these things are interconnected and technology allows us to discover so much more and to interact with sound and vision like a 6th sense experience. Thanks for the links.

    1. My pleasure, Lyn! Anytime the hand of man is introduced to any process, things tend to change. It’s wonderful when that change is for the better, but as you know, that’s not always the case. Thanks as per usual for the interesting links. I’m not very tech oriented, but I would think it wouldn’t be hard to convert the math of statistics into the math of music. I’ve blogged before about synesthesia. I’m fascinated by it. I used to know one friend who saw words as colors, and couldn’t stand to use two words together when their colors clashed. And I have another friend who sees the calendar as a flat array that spreads out in front of her. She’s never late for anything. Intriguing.

  2. The Radio Lab color episode is a joy and inspires further exploration. They even cover one of my favorite sea creatures… https://www.youtube.com/watch?v=E0Li1k5hGBE
    Hadn’t listened to them in years and didn’t realize they were still around. Very easy to add onto my YouTube subscriptions. Thanks Sara!! for this link and thanks Barb for continuing to bring your readers quality, nourishing brain food.

Leave a Reply


Join 639 other subscribers

496,354 hits so far!

Discover more from The View from a Drawbridge

Subscribe now to keep reading and get access to the full archive.

Continue reading